Mynd:Ombrothermic diagram of Amiens.png
Jump to navigation
Jump to search


Stødd av hesi forskoðan: 800 × 382 pixels. Aðrar upploysnir: 320 × 153 pixels | 640 × 305 pixels | 1,024 × 488 pixels | 1,786 × 852 pixels.
Upprunafíla (1,786 × 852 pixel, stødd fílu: 185 KB, MIME-slag: image/png)
Samandráttur
| Frágreiðing |
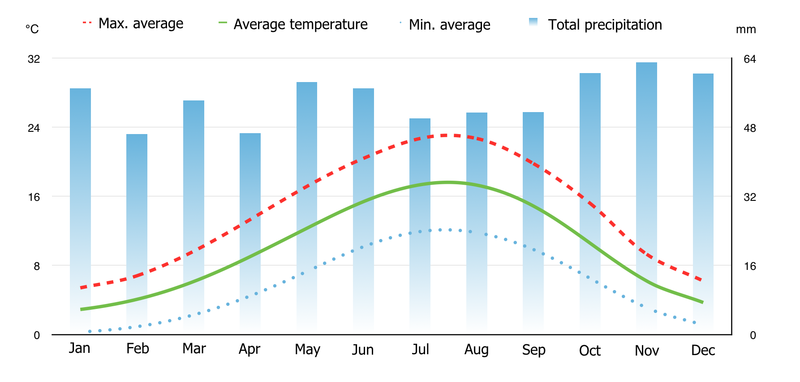
English: Diagram showing the evolution of the average low, high and global temperatures of Amiens, as well as the precipitation bars.
Averages calculated from the last 15 years of collected data from the station of Beauvais and Albert (data available on the "infoclimat" website |
| Dagur |
|
| Kelda |
|
| Høvundur |
|
Lisensur
I, the copyright holder of this work, hereby publish it under the following license:
This file is licensed under the Creative Commons Attribution-Share Alike 4.0 International license.
- Tú ert vælkomin til:
- at deila – at avrita, breiða út og senda verkið
- at remiksa – at tillaga ella broyta verkið
- Undir hesum treytum:
- ognan – Tú mást ognarskrivað verkið á ein slíkan hátt sum er útgreinaður av høvundanum ella lisenseigaranum (men ikki á nakran hátt ið kundi bent á at hesin hevur góðkent teg ella tína nýtslu av verkinum).
- deil undir somu treytum – Um tú broytir, evnar til ella byggir víðari á hetta verk, so kanst tú bert útgeva verkið undir somu ella líkandi lisensi sum hesin.
Søgan hjá fíluni
Trýst á dato/tíð fyri at síggja fíluna, sum hon sá út tá.
| Dagur/Tíð | Lítil mynd | Dimensjónir | Brúkari | Viðmerking | |
|---|---|---|---|---|---|
| streymur | 2. jun 2015 kl. 13:50 | | 1,786 × 852 (185 KB) | EP111 | {{Information |description={{en|1=Diagram showing the evolution of the average low, high and global temperatures of Amiens, as well as the precipitation bars. Averages calculated from the last 15 years of collected data from the station of Beauvais and... |
Nýtsla av fílu
Fylgjandi síða slóðar til hesa fílu: